Marsh Funnel Limitations in Field Testing Drilling Fluids
Common Tool Struggles with High Solids, Gelling
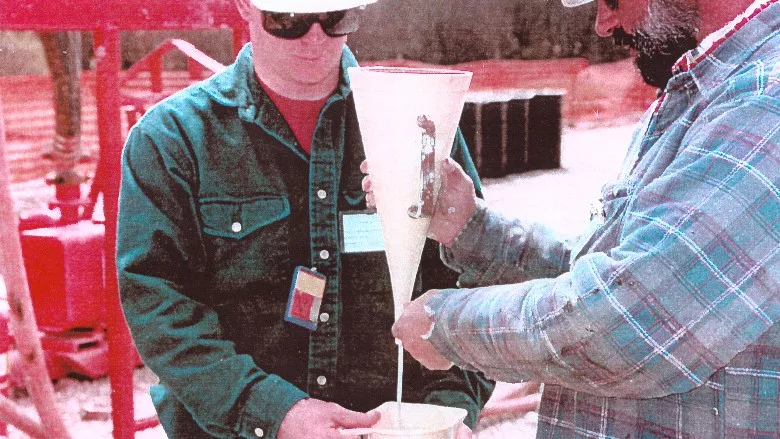
The Marsh funnel is a tried-and-true companion for drillers and mud techs, but it has limits.
Source: U.S. Department of Energy
The drilling world has a few practices reinforced countless times in literature, as well as in mud-schools and seminars. The importance of regular drilling mud testing ranks high among these. While I certainly agree, I believe it is time to throw a proverbial wrench in the system and explain one of the limits of all that collected testing data.
You could fairly call the Marsh funnel the number one, most common tool utilized by drillers in the field for testing drilling fluids. I would go so far as to argue that, in our industry, no other piece of testing equipment even comes close to the ubiquity of the humble Marsh funnel. In some cases, however, the Marsh funnel may not be the best tool.
First, a quick primer on the function of the Marsh funnel. It belongs to a class of tool known as the flow cone. These function by recording the time required for a certain volume of liquid to flow through the orifice and into a collection vessel. That volume can be large for thin liquids that drain quickly, or very small — even a single drop — for very viscous liquids like tar. The Marsh funnel is on the larger size of these cone-based viscosity tools, since it needs to straddle everything from water to semi-solids. The U.S. Marsh funnel tests the time required to pour one U.S. quart (946.3 mL). A metric version measures out 1,000 mL instead, so watch out for that potential confusion.
For water and thin liquids, the Marsh Funnel works just fine. We can debate whether it has enough precision for low-viscosity (near water) liquids but, to me, the real problem with the design appears when you attempt to work with higher-viscosity, gelling fluids.
The funnel has one main point of shear through which fluid passes. The orifice, or inside of the tube at the bottom of the cone, has an inside diameter of 3/16 inches (4.76 mm). The edge of the funnel walls themselves certainly have additional zones of shear, but these have a lesser effect on a fluid. A fluid in a Marsh funnel only sees significant shear when it passes through the orifice into the cup. Shear-thinning fluids then, are at their thinnest at this point and thicker everywhere else. Contrast this to a Fann rheometer, where the spinning sleeve produces a continual shearing of the fluid.
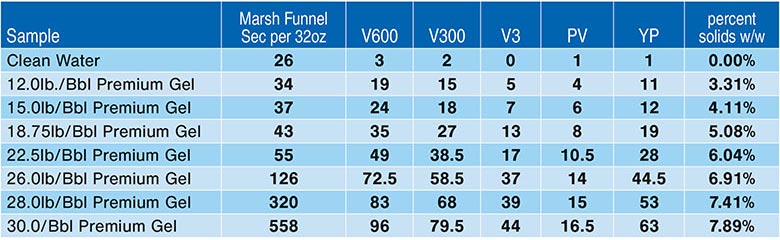
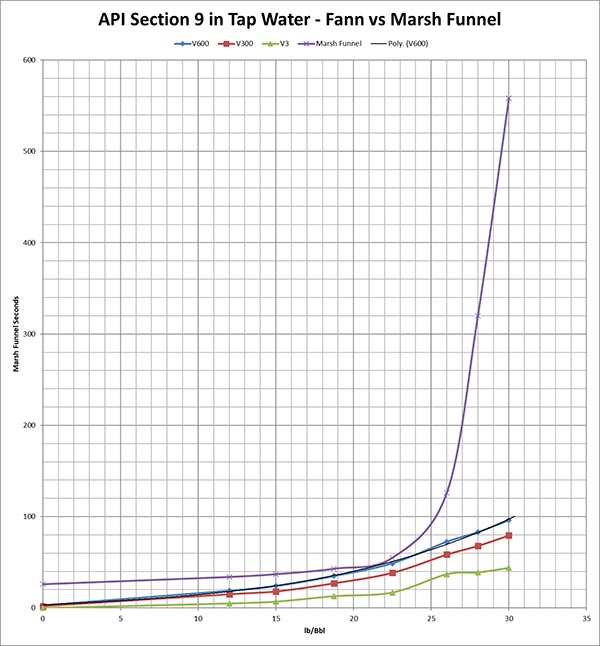
For Newtonian and, arguably, very thin fluids in general, Marsh funnel design would not significantly impact the number of seconds measured. However, for fluids that increase in viscosity when at rest or even have progressive gelling, we see a time-dependent increase in fluid viscosity over the duration of a single funnel test. The more a fluid gels and the stronger those gels are, the more deviation from ideal we observe. Add to this the fact that head pressure drops as fluid is lost, and one can see how a Marsh funnel could slow considerably and bog down before completion. See the graph with this article comparing Fann viscometer data to Marsh Funnel data. Testing involved several different solids contents. You can see no easy, linear correlation between the Marsh funnel and the Fann viscometer data.
The usual calculation for effective viscosity looks like this:
μ = (t-25) ρ
Effective viscosity (μ, in centipoise) equals the quarter funnel time (t, in seconds) minus 25 times density (ρ, in g/cm³).
The Fann viscometer gives us the effective viscosity at the V300 or 300 rpm shear speed. We would expect the effective viscosity calculation based on the Marsh funnel test to equal our V300 value from the Fann viscometer data. As you can see in the second table, it does not even come close.
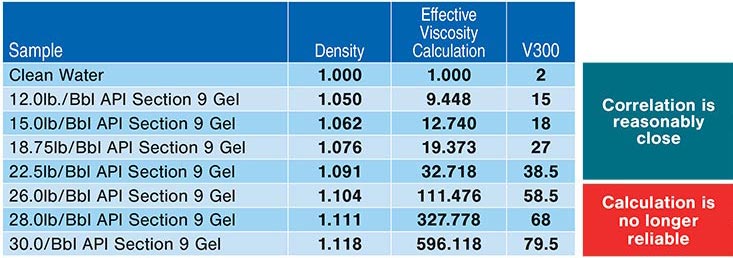
What does the data tell us? The Marsh funnel is very heavily influenced by something that increases the values exponentially. Up through 22.5 lb./Bbl., we can see the V300 values — more or less — closely follow the effective viscosity calculations. Then they go ballistic. This does not mean that, for every single drilling fluid, things always get uncoupled around 22.5 lb./Bbl. solids content. The solids content will likely vary from drilling product to drilling product, from manufacturer to manufacturer and from day to day (since our water sources and mixing equipment may change too). What I am saying, is that we need to challenge Marsh funnel data when we get to high-solids mixes or slurries that show any hint of progressive gelling.
This gives us a basis to talk about both the value and limitations of this common part of a driller’s kit. Next time, we’ll talk about why shear gives Fann viscometers an advantage with these high-solids mixes and discuss tips for getting the best readings out of your Marsh funnel.
Looking for a reprint of this article?
From high-res PDFs to custom plaques, order your copy today!


