Fann Rheometer Advantages and Marsh Funnel Testing Tips
Viscosity Tests in High-Solids Drilling Fluids Helped by Shear

For most water well and HDD applications, a Marsh funnel works just fine. When you start pushing the solids envelope, or use a mix with high potential for gelling, you may want to scale up to a Fann rheometer for more accuracy.
Source: Chemical Engineer / Creative Commons / CC-BY-SA-4.0
Last month, I laid the groundwork for a discussion about the value and limitations of the venerated Marsh funnel, particularly for high solids mixes or slurries with potential for progressive gelling. Here, we talk about why shear gives Fann viscometers an advantage with high-solids mixes. I wrap up with tips for getting the best readings out of your Marsh funnel.
As we talk about the two tests the logical question is, what is the important difference between a Marsh funnel and Fann rheometer? The answer is surprisingly simple: The Fann rheometer spins constantly during the test. That means the entire volume between the rotor and stator (shaft and bob) remains in motion and under shear. Shear speed can change from 3 to 600 rpm, and the fluid can certainly thin or thicken depending on its profile, but the fluid between the bob and shaft remains in motion except for when we conduct a gel-strength measurement.
In the Marsh funnel, a large and ever-changing volume of fluid is stationary: the head. Fluids only experience shear as they flow through the orifice and along the cone walls. This stationary fluid develops gels that grow progressively stronger as they sit undisturbed. As we know from Fann measurement of gel strength, the longer progressive gels sit, the higher the shear required to revert to a flowable liquid.
Add to this the fact that the head pressure inside the cone drops as fluid is lost out the bottom. The amount of shear stress applied to the fluid decreases. We can see how a decreasing shear rate combined with a progressing gel can lead to dramatically higher than expected Marsh funnel values.
We once had engineers working on a civil engineering site come to us with a concern about highly variable Marsh funnel data for their slurries. Data they showed us suggested they were working with two slurries of very different solids contents. The first slurry had roughly 5% solids by weight and the second slurry reached almost 10% solids by weight. Over successive tests of both slurries, they saw a variation of over 250 seconds per quart in the higher-solids mix. Values ranged from 380 to 650 seconds per quart. In the lower-solids slurry, Marsh funnel data showed far more consistency: 39- and 40-second readings all day long. Our own testing of these samples showed even less consistency at high solids than the customer reported.
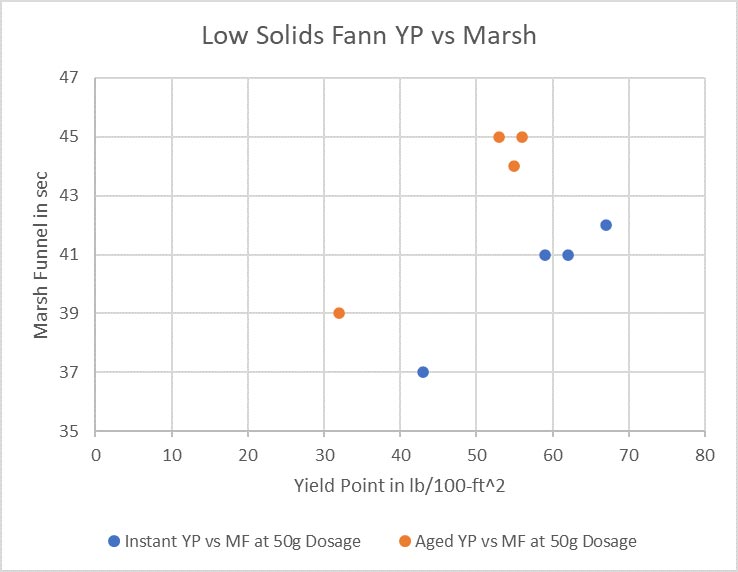
Source: CETCO Drilling Products
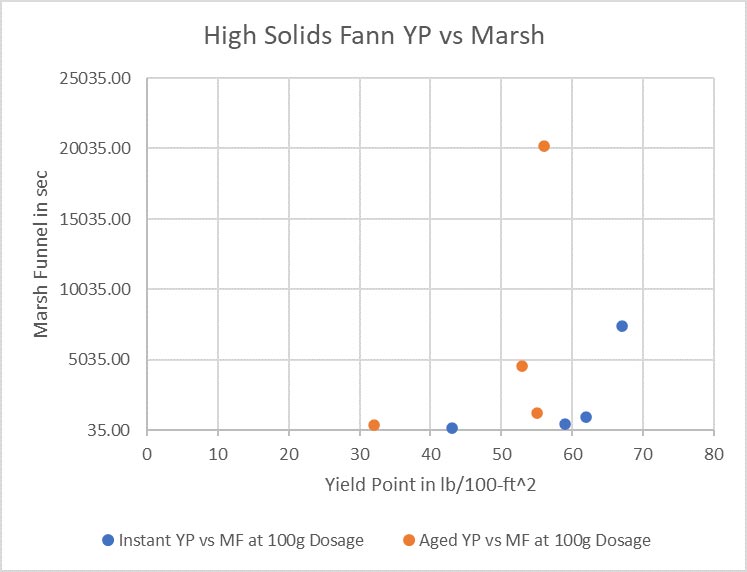
Source: CETCO Drilling Products
Click chart to enlarge
This reflects the impact of gelling on Marsh funnel readings. It takes 10 minutes to drain out some of these slurries and, in that time, high-solids fluids like this can display strong, progressive gels. These gels, in turn, artificially increase funnel viscosity times. Even miniscule differences in rheology get magnified dramatically in situations with high solids and sufficient time for progressive gel formation.
So, what is the path forward and how do we work with what we now know?
The Marsh funnel works best as a difference determiner and to ensure a consistent drilling fluid at mixing time. As long as the fluid tested does not vary in formulation, the Marsh funnel is a useful tool. Beyond that truth, use caution when solids get very high when dramatic variations in Marsh funnel values can prove highly misleading. Knowing all this, I offer these useful tips:
- Abandon the full-volume Marsh funnel when solids climb much above 7% by weight of bentonite in water. This would be a dosage of 26.34 pounds per barrel for an API 13A Section 9 bentonite.
- Try using the smaller lab-barrel graduation in the Marsh funnel cup for comparative testing. Each Marsh funnel cup has markings for a full quart and for 350-mL lab barrel volumes. Progressive gelling will be less of an issue for shorter pour times.
- Use a Fann viscometer for high-solids work or, ideally, for all field testing. I recognize not every contractor has one of these instruments and that they cost much more than a Marsh funnel. If you do use both, recognize that finding a consistent correlation between the two is probably not possible.
- Do not expect two fluids with different formulations, but with similar Marsh funnel values, to be the same. A 50-second low-solids, polymer-heavy slurry will behave (and look) much different than 50-second high-solids, untreated bentonite slurry. In such cases, a Fann viscometer can provide more details about the characteristics of the fluid.
- Consider relying on a shearometer or ball-harp yield-stress data instead of Marsh funnel viscosity. As long as we limit the potential time for gelling to occur, these values will prove more accurate than a Marsh funnel for high-solids mixes or those using a mixed-metal oxide (MMO).
- Train those who conduct testing to help them understand the limits of traditional methods and when to apply new methods. Workers need to know when to second-guess a testing situation.
For decades, generations of drillers have relied on the Marsh funnel for its simplicity. The Marsh funnel, in many instances, provides the data a drilling contractor needs to properly mix and test fluids in the field — particularly for high-yield gels used in water well and horizontal directional drilling. Operators design these fluids for high viscosity at lower solids content. Once we push pass those traditional boundaries, we find the limits. In this case, we see the Marsh funnel may not offer the best test results for very high-solids, gelling fluids. If Marsh funnel readings increase exponentially and show a lack of consistency between tests, open up and consider new testing options as you expand the limits of your muds.
Looking for a reprint of this article?
From high-res PDFs to custom plaques, order your copy today!


