USGS launches nationwide water availability tool for future planning
New national water availability assessment provides data to help evaluate water supply and demand long term across the United States.
The U.S. Geological Survey is rolling out a new nationwide tool designed to help answer a question that is becoming more important every year:
Do communities actually have enough water to meet current and future demand?
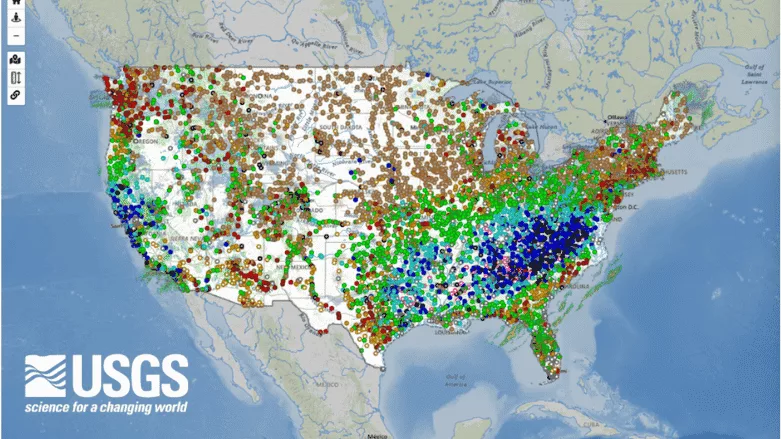
The tool, called the National Water Availability Assessment Data Companion (NWDC), gives water planners, researchers, utilities, and local officials a broader picture of water supply, water use, and long-term availability across the United States.
While water data has always existed in some form, the USGS says this new platform is meant to bring everything together into a centralized and easier-to-use system.
According to the USGS, nearly 27 million Americans, or about 8% of the U.S. population, currently live in areas where water demand consistently approaches or exceeds naturally available supply. Until now, accessing large-scale water availability information often meant piecing together fragmented datasets from multiple agencies and sources. The new tool is designed to eliminate many of those barriers.

“At the national level, the United States has abundant water resources,” said Shirley Leung, lead scientist for the project. “But regional imbalances between supply and demand can create significant challenges that affect millions of Americans.”
Leung said the tool can help decision-makers determine whether water issues in a region stem from limited natural supply, rising demand, or a combination of both.
At its core, the NWDC expands on the agency’s existing “Water Data for the Nation” platform, which already provides real-time and historical observed water data collected from monitoring stations nationwide. The difference is that the NWDC uses modeled estimates to fill in the gaps between those monitoring locations. That means users can now examine water availability across entire regions, including areas where physical monitoring stations may not exist.
“At the national level, the United States has abundant water resources. "But regional imbalances between supply and demand can create significant challenges that affect millions of Americans.”
-- Shirley Leung, Lead scientist, U.S. Geological Survey
The platform provides water supply and demand information across roughly 80,000 watersheds nationwide using 12-digit hydrologic unit codes, commonly referred to as HUC12s. These sub-watersheds generally range between 10,000 and 40,000 acres.
The USGS says the system combines monitoring data, satellite observations, and climate information to generate a national picture of water availability. Users can access up to 40 years of monthly water supply information, including streamflow, snowpack, and soil moisture data. Supply and demand comparison datasets currently span from 2009 through 2020, while irrigation and public water supply data extend from 2000 to 2020.
From fragmented data to faster planning decisions
That level of detail matters because water challenges vary significantly from region to region.
For example, the Mississippi Embayment, which includes portions of Arkansas, Louisiana, and Mississippi, receives some of the nation’s highest natural water supply from rainfall and river systems. However, the USGS found that intensive irrigation for crops like rice and cotton pushes water demand close to or beyond naturally available supply in roughly 42% of the area.
Meanwhile, the Central and Southern High Plains, including parts of Kansas, Nebraska, Oklahoma, and Texas, face a different challenge. In those regions, relatively limited precipitation combines with large-scale irrigation demand tied to corn, soybean, and cotton production.
The Southwest continues to face some of the most obvious supply pressures. Areas of Arizona, Nevada, and New Mexico experience naturally limited water availability while also supporting growing municipal and agricultural demand.
California’s Central Valley also stood out in the data because of its dramatic seasonal swings. According to the USGS, water supply-demand imbalances intensify during summer months as irrigation demand spikes and natural water availability declines.
 Courtesy/ Steven Kelly
The tool is not solely focused on shortage concerns, however.
USGS officials noted that water-rich regions may also benefit from the platform by identifying potential economic opportunities connected to stable water resources. Communities may use the data to guide development decisions while also protecting long-term water sustainability.
The NWDC is also part of a larger initiative tied to the National Water Availability Assessment. That broader effort includes three connected products: the full National Water Availability Assessment Report, the Key Findings website, and the new Data Companion itself.
The main report provides scientific interpretation of national water quantity, quality, and use trends. The Key Findings website focuses on data visualizations and storytelling meant to simplify major conclusions for broader audiences. The NWDC serves as the interactive technical platform underneath both products.
"More than 224 billion gallons of freshwater are withdrawn daily across the lower 48 states for irrigation, public water supply, and thermoelectric power generation."
In practical terms, the tool could become increasingly important for infrastructure planning and long-term resource management.
More than 224 billion gallons of freshwater are withdrawn daily across the lower 48 states for irrigation, public water supply, and thermoelectric power generation. Utilities and local governments regularly face difficult decisions involving treatment plant expansions, groundwater development, industrial growth, and agricultural planning. Many of those investments depend on understanding whether future water supplies can realistically support future demand.
“Public access to data is a cornerstone of the National Water Availability Assessment,” Leung said. “What once required significant resources and time can now be done in minutes, giving communities of all sizes the same foundation for water planning.”
The USGS says the platform remains under active development, with additional features and model outputs expected over time. Officials also plan to continue usability testing to improve how the information is presented and accessed.
As water management challenges continue evolving nationwide, the new platform may help communities shift toward more proactive planning instead of reacting after shortages or supply issues emerge.
For many planners and utilities, the question is no longer simply whether water exists today. It is whether those supplies will remain reliable enough to support future growth, agriculture, infrastructure, and ecosystems for decades to come.
Looking for a reprint of this article?
From high-res PDFs to custom plaques, order your copy today!

John Oldani is an editor, journalist, and reporter with over a decade of experience producing clear, engaging, and well-researched content. He holds a Bachelor of Arts in Journalism from Oakland University, with a focus on financial reporting, editing, and long-form writing. Over the past year, John has specialized in covering the drilling industry, reporting on key developments, policy shifts, and impactful stories shaping the field.
email: johnnyoldaniwords@gmail.com | office: (248) 838-8535
![]()


